ThaiBev’s Sustainability 2025
Home / Social
Health & Nutrition Operation Guidelines

Consumer Health & Safety

Health & Nutrition Operation Guidelines
Use of a Nutritional Profiling System
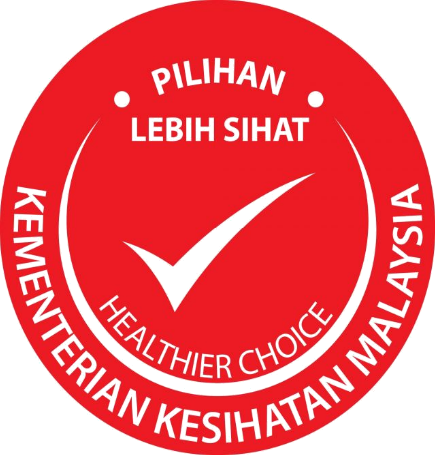
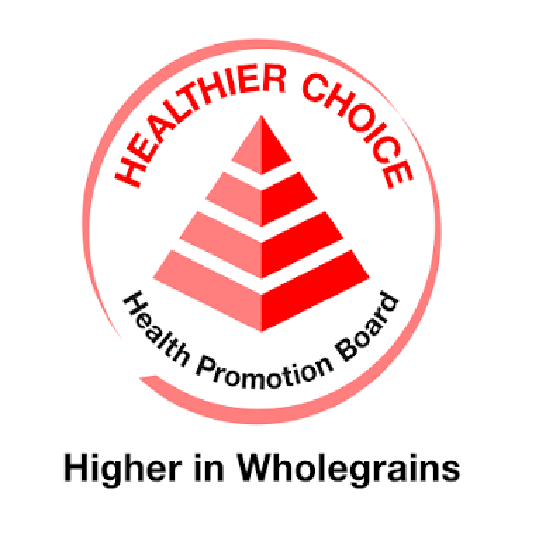
ThaiBev applies the relevant Healthier Choice nutritional criteria in each market where applicable, including Thailand’s Healthier Choice Logo (HCL), Malaysia’s Healthier Choice Logo (HCL), and Singapore’s Healthier Choice Symbol (HCS). These market-specific schemes provide external nutritional benchmarks for product development and reformulation, with criteria varying by product category and local regulatory requirements.

In addition, ThaiBev has established an R&D Stage Gate governance process under which new and reformulated products require management approval to ensure that nutritional value, product quality, consumer needs, and strategic objectives are appropriately considered before market launch.
Health & Nutrition Criteria that Align with External Benchmarks
ThaiBev applies recognized external nutritional benchmarks to guide the development and reformulation of healthier products across its markets. These include the relevant Healthier Choice nutritional criteria in Thailand, Malaysia, and Singapore, where applicable.

The criteria are established by the respective national health and nutrition authorities and are based on defined nutritional thresholds that vary by product category. Key parameters include sugar, sodium, total fat, saturated fat, energy, and beneficial nutrients such as dietary fiber and calcium, as applicable to each market and product category.

ThaiBev uses these externally established criteria as references for setting and evaluating the nutritional profile of products, supporting product development and reformulation toward healthier choices and ensuring alignment with recognized local nutrition standards.
THAILAND
Healthier Choice Logo
(HCL)
MALAYSIA
Healthier Choice Logo
(HCL)
SINGAPORE
Healthier Choice Symbol
(HCS)
Quantified Targets to Reduce Levels of Fat, Salt, Sugars, or Additives
ThaiBev adheres to the quantified targets to minimize Sodium, Sugar, and Fat level in each product – as stated in the criteria for “Healthier Choice” Logo Registration – so that the products may be certified as “Healthier Choice” products.

Vegetable Juice, Fruit Juice, Carbonated Drinks, and Soft Drink
  • Sugar : ≤ 5 grams per 100 milliliters; and
    ≤ 15 grams per product
  • Sodium : ≤ 40 milligrams per 100 milliliters; or
    ≤ 100 milligrams per 100 milliliters (only in beverages with composition of tomatoes equal to or more than 90%)
  • Energy : ≤ 40 kilocalories per 100 milliliters; or
    ≤ 20 kilocalories per 100 milliliters (in products with both sugar and artificial sweetener); or
    ≤ 10 kilocalories per 100 milliliters (in products with only artificial sweetener)
Chocolate Drinks, Coco, Malt Extract, and Drinks with solutions of Milk or Proteins
  • Sugar : ≤ 5 grams per 100 milliliters; and
    ≤ 15 grams per product
  • Fat : ≤ 1 grams per 100 milliliters; and
    ≤ 3 grams per product
  • Sodium : ≤ 100 milligrams per 100 milliliters
  • Energy : ≤ 60 kilocalories per 100 milliliters; or
    ≤ 40 kilocalories per 100 milliliters (in products with both sugar and artificial sweetener)
Small Meal / With Meat (e.g. Sandwich with meat stuffing)
  • Energy : 150-250 kilocalories per product
  • Sugar : ≤ 2.5 grams per 100 kilocalories
  • Fat : ≤ 3.25 grams per 100 kilocalories
  • Sodium : ≤ 175 milligrams per 100 kilocalories
Small Meal / With Cream, Custard, Jam, or Fruit (e.g. Sandwich with cream stuffing)
  • Energy : 150-250 kilocalories per product
  • Sugar : ≤ 3.75 grams per 100 kilocalories
  • Fat : ≤ 3.25 grams per 100 kilocalories
  • Sodium : ≤ 150 milligrams per 100 kilocalories
Bread
  • Sugar : ≤ 6 grams per 100 grams
  • Fat : ≤ 5 grams per 100 grams
  • Sodium : ≤ 450 milligrams per 100 grams
Bakery Products (Cookies and Cakes)
  • Energy : ≤ 110 kilocalories per product
  • Sugar : ≤ 20 grams per 100 grams
  • Fat : ≤ 22 grams per 100 grams
  • Sodium : ≤ 300 milligrams per 100 grams
Note: In Thailand, the applicable Healthier Choice criteria currently specify a sugar level of less than 6 g per 100 ml. A transition/grace period is currently provided to allow manufacturers sufficient time to reformulate their products and utilize existing packaging during the transition period.
Quantified Targets for Fortified Foods with Increased Nutritious Ingredients
ThaiBev adheres to the quantified targets to increase nutritious ingredients (such as Fiber) level in each product – as stated in the criteria for “Healthier Choice” Logo Registration – so that the products may be certified as “Healthier Choice” products.
Small Meal / With Meat (e.g. Sandwich with meat stuffing)
  • Energy : 150-250 kilocalories per product
Small Meal / With Cream, Custard, Jam, or Fruit (e.g. Sandwich with cream stuffing)
  • Energy : 150-250 kilocalories per product
Bread
  • Energy : Fiber : ≥ 3 grams per 100 grams
Bakery Products (Cookies and Cakes)
  • Energy : Fiber : ≥ 3 grams per 100 grams
Products Specifically Aimed at Priority Populations

ThaiBev has several health & nutrition products that were developed with specific populations as target consumers – particularly those that may require a boost for their daily activities.

ZEA Tuna Essence
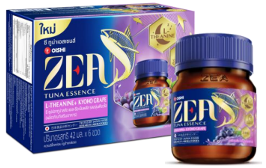
ZEA Tuna Essence – the Company’s dietary food supplement product – was specifically developed to address key concerns in adults, with the priority being office workers who must utilize intense cognitive and optical functions.

The various beneficial effects gained from the consumption of ZEA Tuna Essence include enhanced brainpower/memory, better sleep, and clearer vision.

In addition, the Company has since released new varieties of ZEA Tuna Essence products – specifically to target the elderly priority populations. These products come in 3 different flavors, with each flavor designed to address specific health issues in the elderly – ZEA Tuna Essence: PASSION FRUIT was designed to improve memory, ZEA Tuna Essence: L-THEANINE+ KYOHO GRAPE was designed to improve sleep, and ZEA Tuna Essence: LUTEIN+ BERRY was designed to improve optical functions.
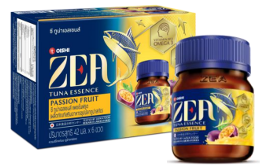
ZEA Tuna Essence:
PASSION FRUIT

ZEA Tuna Essence:
L-THEANINE+ KYOHO GRAPE

ZEA Tuna Essence:
LUTEIN+ BERRY
OISHI Gold Genmaicha (High Vitamin B)
OISHI Gold Genmaicha – the Company’s brown rice green tea products – had released new varieties of the products, with focus on high Vitamin B nutritional values. These products particularly targets adults/senior customers to assist with relaxation amidst the stressful working environment – as Vitamin B helps with the healthy functioning of the nervous system.

Power Plus Electrolyte Drinks
Power Plus – the Company’s electrolyte drinks – was developed for people with regular fitness activities as the priority targets and is aimed at providing the necessary energy and freshness over the course of their workouts.

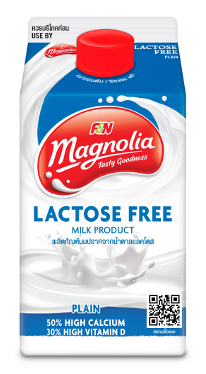
Magnolia Lactose Free
Magnolia Lactose Free – the Company’s milk products – boasts 50% high calcium and 30% high vitamin D, helping the consumers’ bodies to absorb calcium more efficiently and providing enough necessary calcium intake within only 2 servings.

An important characteristic of Magnolia Lactose Free is that they were developed for people who are lactose intolerant so that they may enjoy both the tase and nutritious properties of the products without having to worry about health concerns.
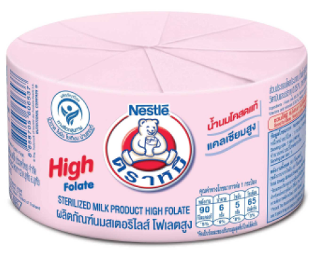
Bear Brand Sterilized Milk (High Folate)
Bear Brand Sterilized Milk (High Folate) – the Company’s sterilized milk products – is a variation of the Company’s Bear Brand Sterilized Milk products’ portfolio, with pregnant women as the priority target group. This is achieved by utilizing the various properties of Folate that may be to the nutritious benefits of pregnant mothers, along with their babies.

Folate is a crucial vitamin for women during pregnancy, as it is important to the proper development of the baby’s brain and spinal cord. It is especially important for the growth of red blood cells which help the neural tube in the brain to develop properly. If the neural tube does not close properly, birth defects can occur in your baby along with spinal cord issues. Folate may also help in reducing the chance of premature birth and miscarriage.

Portion-Control Packaging Design
ThaiBev provides information via labelling on products’ packaging to advise recommended serving sizes of each product, so that consumers may consume an amount appropriate and satisfactory for their taste – without facing possible detrimental feedbacks due to overconsumption. The information provided on the products’ labels include recommended serving size, amount per serving, and energy provided.

In addition, the Company also provides various portion sizes of the same products so that the consumers may have the freedom to choose the appropriate portions in accordance to their needs and prevent unnecessary overconsumption.
R&D Investment
R&D Investment to Improve Nutrition
  • Oishi Trading Co., Ltd – a ThaiBev’s subsidiary – collaborated with Kasetsart University in a research project focused on the extraction of polyphenols from tea residues generated during the production of green tea beverages.
  • OISHI Group – a ThaiBev’s subsidiary – collaborated with Mae Fah Luang University in a research on the medicinal properties of raw materials used in OISHI Group’s products.
The findings from this research is intended to be used in improving the nutritional and medicinal properties in the Company’s beverage products for the consumers’ benefit.

R&D Investment to Improve Affordability or Accessibility of Healthy Products
  • OISHI Group – a ThaiBev’s subsidiary – collaborated with Mahidol University in a research to study the effect of OISHI Group’s products on the reduction of blood lipid level”.
The findings from this research is intended to be used for exploring the possibilities of generalizing the Company’s beverage products to be safely accessible for those with high blood lipid level without having to worry about health concerns.
Revenue from products FY 2022 FY 2023 FY 2024 FY 2025*
Total revenue from healthy products (THB mn) 10,398 11,715 11,888 38,705
Total food & beverage revenue (THB mn) 29,222 21,977 21,521 53,685
Percentage of healthy products revenue 36% 53% 55% 72%
*FY2025, the reported data includes F&N

Read More Information about
Consumer Health and Safety
in Sustainability Report 2025