
Food Loss and Waste Data Breakdown
 Food Loss and Waste |
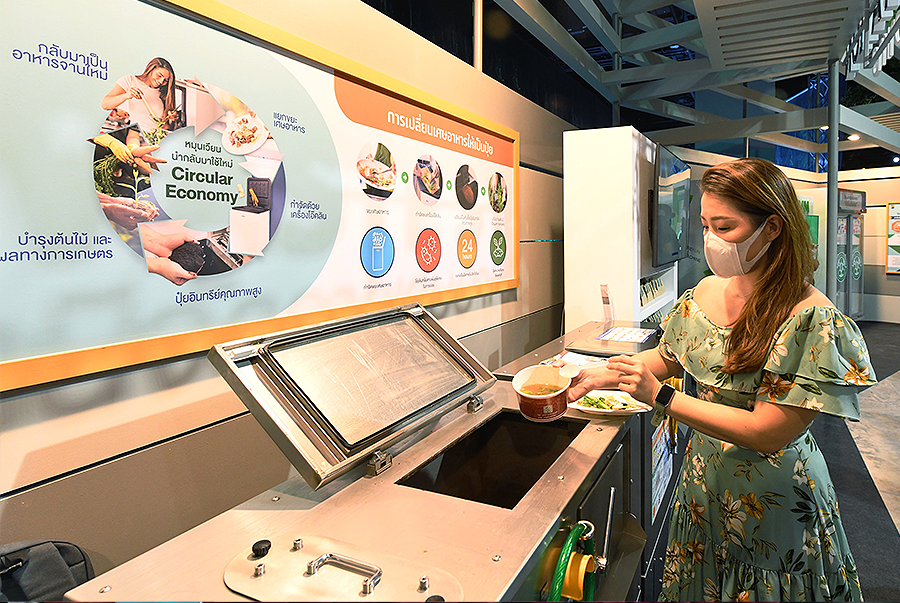
 Food Loss and Waste Management Process |
 Food Loss and Waste Collaboration |
 Food Loss and Waste Data Breakdown |
Food Loss and Waste in 2023 |
Utilization | |||||
| Animal Feed | Fertilizer | Biofuel | By products / Sold to employees | Food Donation | Disposal | |
| Wasted/expired/unqualified products from manufacturing processes | 161,691.05 | - | - | - | - | - |
| Food ingredients | 172.78 | - | - | - | - | - |
| Fish scraps | 52,715.46 | - | - | 3,401.72 | - | - |
| Vegetable scraps | 14,463.49 | 290.30 | - | - | - | |
| Used vegetable oil | - | - | 1,316,358.53 | - | - | - |
| Restaurant waste | - | - | - | - | 16,347.75 | 976,609.71 |
| Total | 229,042.78 | 290.30 | 1,316,358.53 | 3,401.72 | 16,347.75 | 976,609.71 |
| Total Food Loss and Waste | 2,542,050.79 | |||||
| Food Loss and Waste for Alternative Purposes | 1,565,441.08 | |||||
| Food Loss and Waste Discarded | 976,609.71 | |||||


| Intensity (kg/mil THB) | ||||
| 2019 | 2020 | 2021 | 2022 | 2023 |
| 14.75 | 9.82 | 10.39 | 8.45 | 8.89 |
| Unit: Metric Tonnes | 2019 | 2020 | 2021 | 2022 | 2023 | Target (2023) |
| Total Weight of all Food Loss & Waste | 4,043 | 2,548 | 2,552 | 2,366 | 2,542 | 2,550 |
| Total Weight of Food Loss & Waste Volumes Used for Alternative Purposes | 1,940 | 1,617 | 1,533 | 1,596 | 1,565 | 1,550 |
| Total Food Loss & Waste Discarded | 2,103 | 931 | 1,019 | 770 | 977 | 1,000 |
| Food Loss & Waste Intensity (kg / million THB) | 14.75 | 9.82 | 10.39 | 8.45 | 8.89 | 8.91 |
| Coverage | 100.0% | 100.0% | 100.0% | 100.0% | 100.0% |

ThaiBev's Sustainability

ENVIRONMENTAL
![]()
SOCIAL