
Food Loss and Waste Data Breakdown
 Food Loss and Waste |
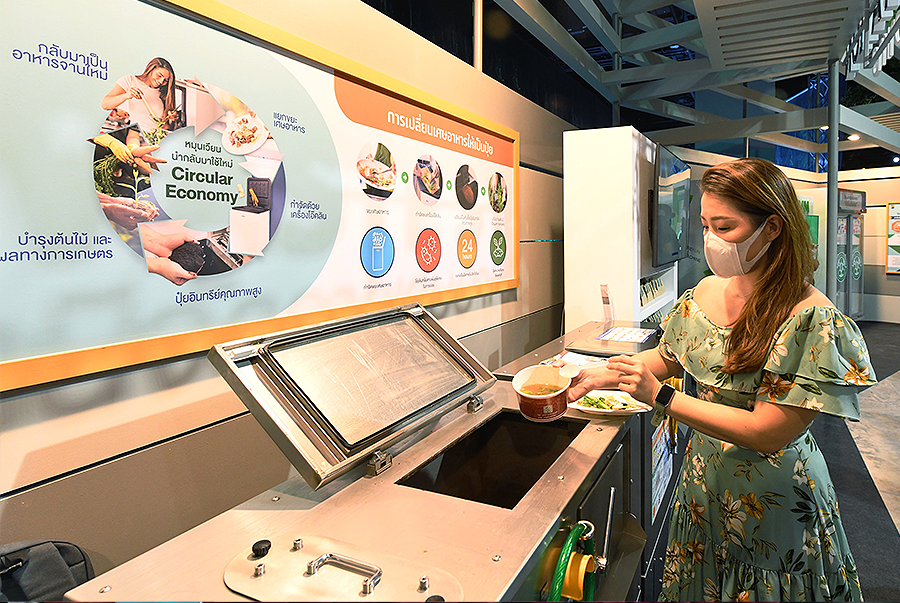
 Food Loss and Waste Management Process |
 Food Loss and Waste Collaboration |
 Food Loss and Waste Data Breakdown |
Food Loss and Waste in 2024 |
Utilization | |||||
| Animal Feed | Fertilizer | Biofuel | By products / Sold to employees | Food Donation | Disposal | |
| Wasted/expired/unqualified products from manufacturing processes | 176,130.82 | - | - | 801.00 | - | - |
| Food ingredients | 55,389.19 | - | - | - | - | - |
| Fish scraps | 40,092.12 | - | - | 24,490.19 | - | - |
| Vegetable scraps | 4,897.06 | 1,316.09 | - | - | - | |
| Used vegetable oil | - | - | 1,466,313.00 | - | - | - |
| Restaurant waste | - | - | - | - | 8,399.20 | 1,743,886.70 |
| Total | 276,509.19 | 1,316.09 | 1,466,313.00 | 25,291.19 | 8,399.20 | 1,743,886.70 |
| Total Food Loss and Waste | 3,521,715.38 | |||||
| Food Loss and Waste for Alternative Purposes | 1,777,828.68 | |||||
| Food Loss and Waste Discarded | 1,743,886.70 | |||||


| Unit: Metric Tonnes | 2019 | 2020 | 2021 | 2022 | 2023 | 2024 | Target (2024) |
| Total Weight of all Food Loss & Waste | 4,043 | 2,548 | 2,552 | 2,366 | 2,542 | 3,522 | 3,550 |
| Total Weight of Food Loss & Waste Volumes Used for Alternative Purposes | 1,940 | 1,617 | 1,533 | 1,596 | 1,565 | 1,778 | 1,600 |
| Total Food Loss & Waste Discarded | 2,103 | 931 | 1,019 | 770 | 977 | 1,744 | 1,950 |
| Coverage | 100.0% | 100.0% | 100.0% | 100.0% | 100.0% | 83.06% |

ThaiBev's Sustainability

ENVIRONMENTAL
![]()
SOCIAL


